

Website Speed
Website speed is very important for SEO. Google won’t want to deliver a search result to a user if that user has to wait 10 seconds for it to load. You may be thinking that 10 seconds doesn’t sound like long, but the effect a page load can have on bounce rate and revenue is crazy! Here’s some statistic to put it in perspective:
- 9.6% of visitors bounce when the page speed is 2 seconds.
- 32.3% of visitors bounce when the page speed is 7 seconds.
- Users visit an average of 5.6 more pages when a page load time is 2 seconds compared to 8 seconds.
- + 3% conversions for every second from 15 seconds to 7 seconds
- + 2% conversions for every second reduced from 7 seconds to 5 seconds.
- + 1% conversions for every second reduced from 4 seconds to 2 seconds.
Not displaying
Optimising Images
Minification
Imagine
If
I
Wrote
My
Blog
Like
This
Reading it in a column like that probably took you a bit longer than if I wrote ‘Imagine if I wrote my blog like this’. So what’s my point?
Well when we code, it’s usually best practice to organise our code using ‘indents’. Here’s an example:
<div class=”unordered-list”>
<ul>
<li>List Point 1</li>
<li>List Point 2</li>
<li>List Point 3</li>
<li>List Point 4</li>
</ul>
</div>
This code above details a list that will display on viewers browsers like so:
- List Point 1
- List Point 2
- List Point 3
- List Point 4
The reason it is best practice to organise code like this on a website is because it keeps it clean so coders can keep track of where they are, or easily go back to find certain elements they may need to edit. We can easily see that the bullet point list (called an unordered list) is contained in a tag with a class of “unordered-list” and with 4 bullet points contain inside it to be displayed. The same list would be displayed if you wrote the list in html like so:
<div class=”unordered-list”><ul><li>List Point 1</li><li>List Point 2</li><li>List Point 3</li><li>List Point 4</li></ul</div>
This is much harder to read, so coders don’t tend to do this!
The problem with this is, a web browser reads the code more like a book. Starting from left to right, and working itself down every line until it has fully crawled the page and displayed the content. Similar to us, a web browser is slower when reading lines of code displaying downwards like my example. Our solution to this is minification.
Minification is where we will take code like this:

And display it like this:
![]()
Just like my example. A browser will be able to read this code much faster now that it is all on one line, rather than spread out over 8 lines.
How to minify code
Minification is a simple process, you can either try it manually, or automatically (Using a plugin).
Note: I’d advise taking a back-up of any files you’re planning on minifying. Minification can sometimes break a website depending on how it’s been coded (especially with Javascript).
The Manual Way
To manually minify a website simply take the code of the pages and run it through a minification site. I would personally use Minify Code. Copy and paste the end product back into the relevant file and reupload it.
The Automatic Way
The automatic way would be to use a plugin (I only know those that are on WordPress). A simple Google to find the right plugin for you could work. I’ve used Autoptimize and never had an issue, so it may be worth checking that tool out!
Server Speed
 This is just under 4 second load time – which in my eyes isn’t good enough. This is on my list to optimise!The second way to check is by using my other favourite tool. The Lighthouse Audit feature on Google Chrome. To get this to you’ll need to right click your website and bring up the ‘Inspect’ tool. From there, navigate your way to the ‘Audit’ tab. Select what you would like to be tested on the site, for speed tests ensure that ‘Performance’ is selected. If your server speed has been flagged then it will appear under the ‘opportunities’ tab and will display something that looks a bit like this:
Rendering
Rendering is the function of translating code and displaying it as a the visible content that you will see on a website. There are numerous different types of rendering but I want to focus on two important ones for SEO.Bot Rendering: How search engines bot’s think your page looks.*INSERT GOOGLE WEBMASTERS SNIPPET OF GOOGLE BOT RENDER ON YOUR SCREEN*Browser Rendering*INSERT GOOGLE WEBMASTERS SNIPPET OF BROWSER RENDER ON YOUR SCREEN*
Not displaying
Bot Rendering
Browser Rendering
 This may look familiar, it’s the same snippet using in the ‘Server Speed’ section of this article. As you can see this tool has broken down the way a browser asks the server for the file. The ‘Wait’ time is how long the browser is waiting for a response from the server to provide the necessary file to read to load up the page.Once the server sends back the page of code for the browser to read the browser will then begin parsing the code and constructing the DOM.
Document Object Model (DOM)
As mentioned before a webpage is a file, this file can be displayed as a visual webpage with images, styling and functionality, or in raw code. Either way, it is the same document. The DOM is a programming interface that allows the construction and positioning of certain elements in the page to translate the code into the visuals that you see on your screen.The DOM does this by finding HTML and CSS tags can converts them into Nodes. For clarity, I’ll show you what a DOM looks like the nodes that make it. I’ve put some not so subtle arrows pointing at the nodes on the DOM.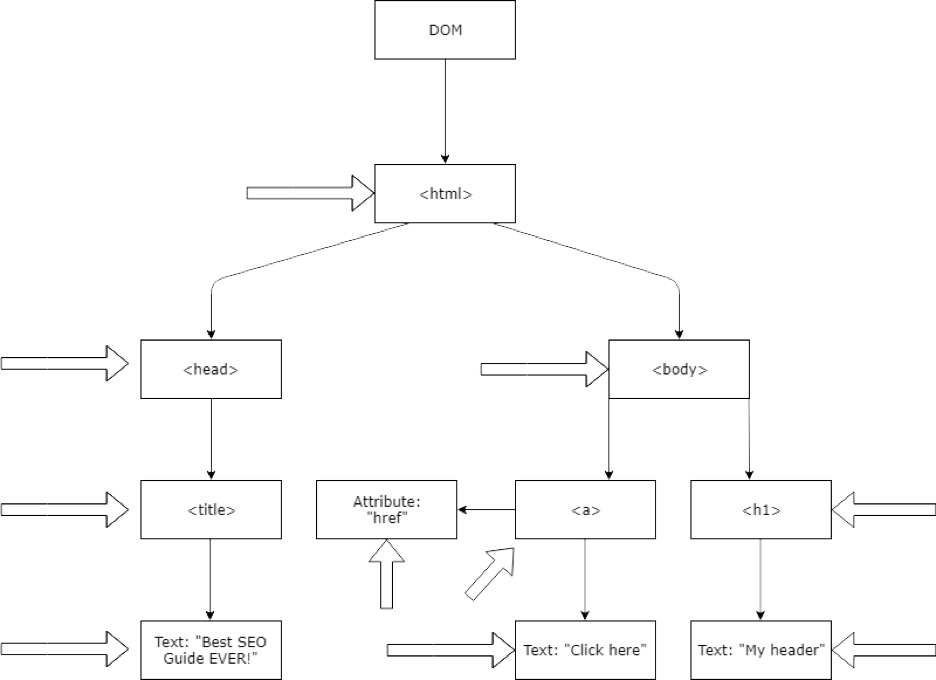 When the tags are converted into elements they will be listed below their parent tag.If I haven’t confused you enough, then this might. As the browser is reading through the lines of HTML code it should eventually come across the links that pull in other external resources. Such as the stylesheet containing the CSS. When this link is found, the browser will request that the server provide that linked file and the whole process starts again. This time, the browser will create what is called the CSS Object Model (CSSOM).
 The CSSOM is similar to the DOM, but different. The DOM groups together the HTML code and then pairs it with the CSSOM to style it and gather an understanding of how it should be rendered. Once the browser has congregated all of the nodes with their corresponding parents and elements it begins constructing the render tree.The render tree is a combination of the DOM and CSSOM. This means the browser has an understanding of where the elements are, the parent elements that they appear under, and their styling (which includes their positioning). The render tree has a similar layout except with all of the nodes combined.From here we move onto the layout stage. This allows the webpage’s elements to appear in their exact position and size within the device’s viewport.Once the relevant computations have been made the ‘Paint’ is carried out. This consists of taking the nodes from the render tree and converting them into pixels to display on the screen.Note: I can go into more detail on how this works but right now, this is enough to know from an SEO point of view.
Rendering Recap
The reason I’ve gone into detail for the Browser and Bot rendering is because having an issue with either one of these can affect SEO. Usually an issue with browser rendering also means the same issue for bots. In a rare circumstance where this is not the case, you should still fix it as soon as possible because an issue with browser rendering can cause an increased bounce rate, or other bad user behavior signals; all of which can affect SEO.
Render Blocking CSS
When calling for the CSS to build the CSSOM, the browser will stop rendering any processed content until it has finished the CSSOM construction. This means that while the CSSOM is being built, the render is being completely blocked, meaning that the website will not appear properly until finished. Sometimes when loading a website (especially with slow internet speeds) you will witness what is called a ‘Flash Of Unstyled Content (FOUC)’. This is when the browser is rendering the html elements but is still yet to construct the CSSOM and sprinkle that into the mix.
Not displaying
Optimising the Critical Rendering Path
Measuring the Critical Rendering Path
- Download Chrome 41 – Google Bot uses the same Web Rendering Service (WRS) as Chrome 41.
- Right Click on the web page and click inspect navigate to ‘Network’ and refresh the page – This will flag up any issues retrieving elements on the page.
- Do the same with Timeline – This will bring up how the DOM was formed and give details into the render path of the page.
 Here you should be able to see anything flagged that effects the website’s load or render time. The changes you make can be instantly re-tested which is always refreshing to hear in the SEO world.
Common Issue’s that effect render times
Lazy Loading
Lazy loading is a technique that defers the load of non-critical resources when the webpage is loading. These non-critical resources are usually images that appear below the fold on a webpage. This is beneficial because without lazy load, if you were to load an image heavy home page of a website, but instantly use the homepage to navigate further to an inner page, the browser would load up a whole bunch of images that you never even looked at. This uses both bandwidth, increases the browser load time, plus uses up additional battery, data and other system resources. The solution is to enable Lazy loading for Off-Screen images. This means that the image won’t begin loading in until the bottom of your browser is a set amount of pixels away from the image.To lazy load images on WordPress you can either use a plugin. Or, the manual way.Defer Unused CSS
A browser has to find and read all external CSS stylesheets before it can display any content. If a browser displayed the HTML before understanding the CSS then you would find that almost all websites will display a FOUC before snapping into place!The CSS needed to display the content of the page is called ‘Critical CSS’. The optimal approach to deliver critical CSS is to inline it into theof the HTML. You can do this by setting < style > tags and then adding your relevant CSS within this. You can also look at splitting up your stylesheets into different files organised by media queries. You can then add a media attribute to each stylesheet link. When loading a page, the browser will only block the first paint to retrieve the stylesheets that match the users device.Uncritical CSS is the CSS that the page might need later. For example, clicking a button that causes a modal to appear. The CSS for this is uncritical because the button can’t be clicked until the initial render is complete, therefore the modal will never be displayed when the page is first loaded.Detecting Critical CSS – Bring up the Inspect tool on Google Chrome and bring up the ‘Coverage’ tracker. If you can’t find it, use the option menu at the bottom to bring it up. Click the loop looking icon to run a refresh and log the requests.You will see metrics at the bottom that look like this:
 This will tell you how much of the information is used and unused.
Render Blocking Scripts
- Consider inlining critical scripts in your HTML.
- For non-critical scripts consider marketing them with async the defer or defer attributes.
HTTP/2
HTTP means Hyper Text Transfer Protocol. It is the protocol that directs the actions webservers and browsers should take in response to certain commands. When you enter a URL into your browser, this sends a command to the website’s web server directing it to provide the web file for the browser to read and display the page.Nowadays the web standard is a transfer protocol called HTTP/2, which outdates its HTTP/1.1 predecessor. HTTP/2 is designed to make sites faster, simpler and more vigorous. The best news is that HTTP/2 is backwards compatible with HTTP/1.1.How to switch to HTTP/2The switch has to be made server-side, if your server doesn’t currently load the website over HTTP/2 then I’d advise transferring your website away to another provider that can offer this, or get in touch with your current host to discuss if the switch is going to be made.
Status Codes
Whenever you load up a webpage the HTTP request will send back a response code. This response code gives insight on the status of the response from the server. These are listed below:
Not displaying
2XX’s
3XX’s
4XX’s
4XX errors codes usually indicate an error with loading the page.
400 – This is normally due to a bad syntax or inclusion of characters that the sever can’t understand.
401 – Unauthorised, similar to a 403 except the response gives you a authenticate header allowing you to authenticate to access the page.
402 – The error response is usually ‘payment required’ but this hasn’t been used in a while.
403 – This means the page is forbidden. The resource may be restricted for access using http protocols.
404 – This means the page can’t be found. Either it has been removed or the URL has been typed incorrectly.
5XX’s
.htaccess file
The .htaccess file acts as a directory for browsers and bots to follow when loading or crawling a website. The directory sits on the server in the root file. Developers can edit this file to perform a large variety of different functions.
Not displaying
Apache Redirects
GZIP Compression

 Testing if GZIP is presentNumerous online ‘SEO Checkers’ will probably flag up if GZIP compression is present on the site. If that fails, then simply type in ‘GZIP Compression Checker’ on Google and you’ll probably find loads of results to put your site in to be checked.
What else?
Schema Markup
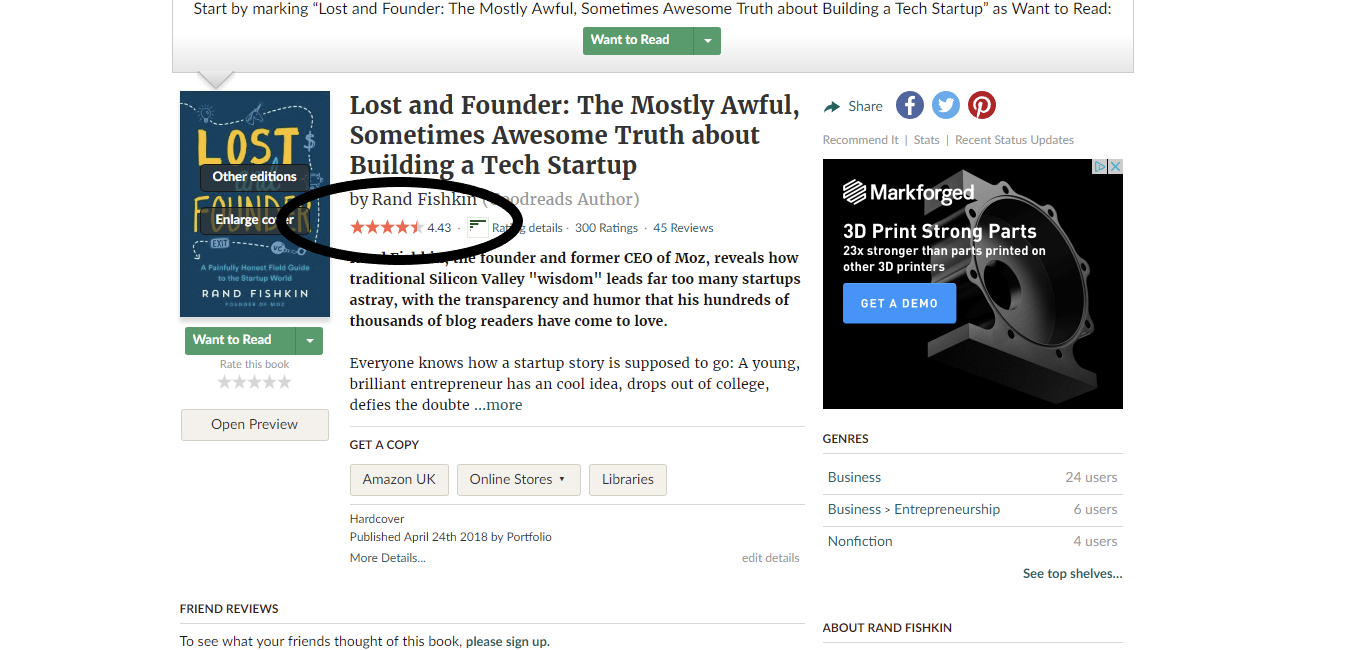
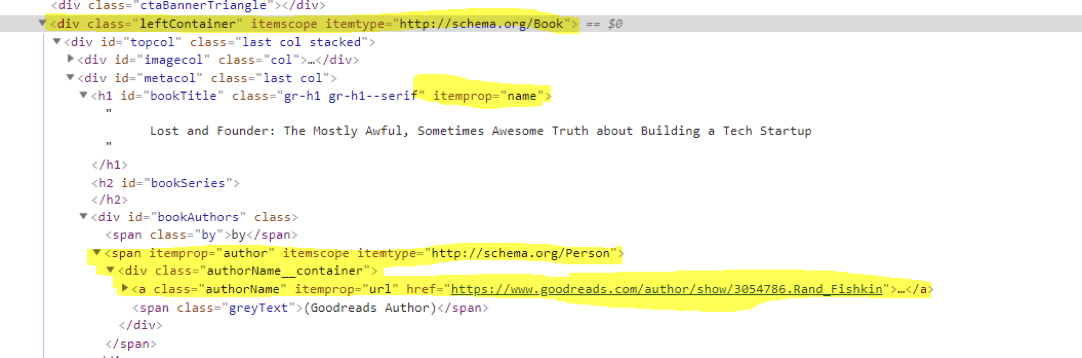
Schema Markup (or just Schema) is a markup language that makes it easier for search engines to understand content and can directly contribute to how a result can appear in the SERPs. It is commonly referred to as ‘structured data’ because that’s exactly what it does, structures data. Let me show you a quick example:Lost and Founder is an awesome book by Rand Fishkin (of whom I am a big fan of! – could you tell?) When conducting a Google search on this book I am greeted by the following results:
Not displaying
View example

Not displaying
View example
Not displaying
View example

Not displaying
View example
0 Comments